
SAFE AND EFFECTIVE? LET’S BE OBJECTIVE.
COVID VACCINES MINISERIES PART 2: BREAKING DOWN THE NUMBERS BEHIND SAFETY AND EFFECTIVENESS
For over a year, the COVID-19 pandemic has ravaged the globe, killing nearly 4 million people 1 and forcing everyone to stay at home as much as possible. Recently, the safe reopening of schools, businesses, and recreation facilities has been a huge relief for the millions of us who suffered from the loneliness and isolation of mandatory lockdowns. And it’s all thanks to vaccines! At the time of writing, 10.8% of the world population and 46.1% of the United States population have been fully vaccinated for COVID-19 2 . But while millions of people jumped at the chance to get their shot and resume normal life, others remain skeptical. This miniseries will break down the flurry of information surrounding COVID-19 vaccines, so you can feel confident signing up. Last week, we learned how vaccines work, what COVID-19 vaccines are currently in use, and what different technologies are used in these vaccines. In this part, we’ll break down the numbers - how effective are these vaccines? How safe are they? What is your risk of side effects?
EFFICACY AND EFFECTIVENESS
First things first, let’s tackle the terminology. Efficacy and effectiveness are tossed around pretty much interchangeably in news headlines, generally taken to mean “how well this vaccine performs.” Yet, the two terms have different meanings. Efficacy is how well the vaccine performs in ideal conditions - that is, among healthy participants and with perfect storage and administration of the vaccine itself. In the real world, things aren’t nearly as perfect. Not everyone is perfectly healthy, people have different habits and exposures, vaccine vials aren’t always kept at the perfect temperature, and people don’t always come back for their second dose when they’re supposed to. Effectiveness is how well the vaccine performs in the real world, with all of these complications 3 . Effectiveness is generally the only number we care about, because it’s the most realistic. So what do we mean by “how well the vaccine performs?” In this case, it’s the percentage reduction in COVID-19 cases seen in vaccinated people compared with unvaccinated people 4 . For example, an effectiveness of 95% means that 95% of the cases among unvaccinated people would have been prevented if those people were vaccinated. Or, in other words, for every 20 cases seen in unvaccinated people, only 1 case would be seen among the vaccinated crowd. The reduction in risk is 1-(1/20)=0.95=95%.
It’s a common misconception that a 95% effectiveness means that 5% of vaccinated people will get COVID-19. Let’s compare this to the actual definition to see just how different these interpretations are. If you aren’t vaccinated, a reasonable absolute risk of getting COVID-19 is 1% over a span of 3 months. If you got vaccinated, this risk would be reduced by 95%, so your new absolute risk of getting COVID-19 is 0.05%. The real risk (0.05%) is 100 times smaller than 5%! You can easily see why this common misconception can scare people, so it’s important to correct their understanding of effectiveness when you can 5 .
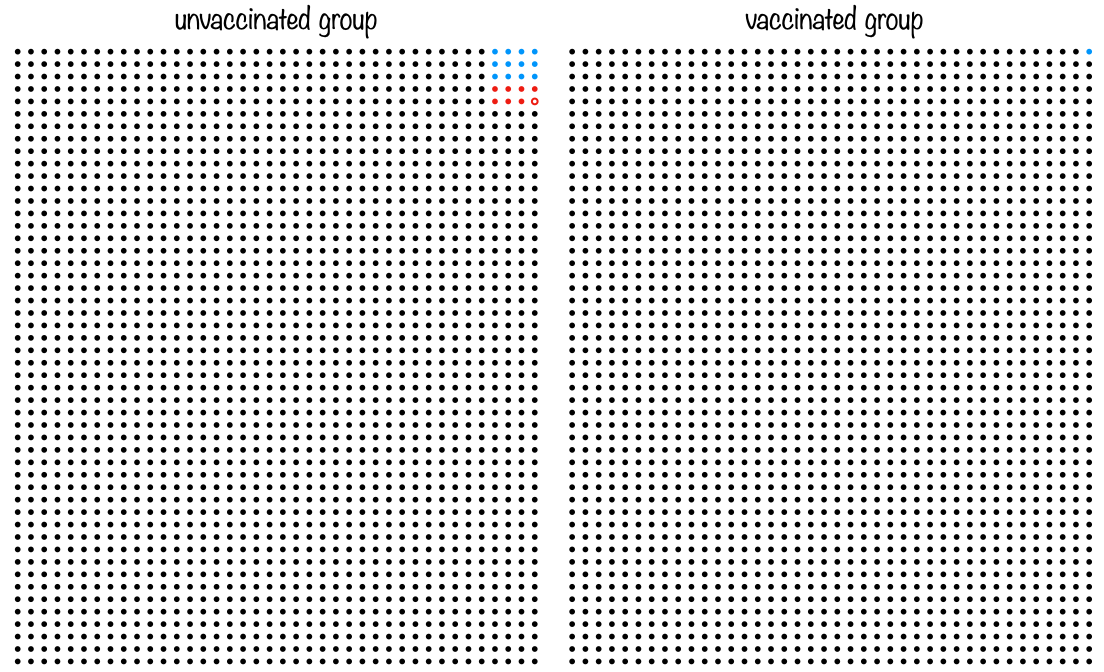
Figure 1: Each circle represents a person, with 2,000 people in each block. If you are unvaccinated, your risk of getting COVID is 1% over 3 months, as shown by the red and blue circles in the left side of the figure. The blue circles represent milder infection, and the red circles are severe infection and hospitalization. The outlined circle represents a death. In the vaccinated group, 95% of the infections are prevented, leaving only one COVID case across all 2,000 people. In addition, severe infection, hospitalization, and death are entirely prevented by the vaccine, so this single filled circle is blue. Of course, this is an average over the entire population - for at-risk groups like the immunocompromised or elderly, vaccination saves even more lives.
Effectiveness is calculated with a simple equation 4 :

Let’s calculate the Pfizer vaccine’s effectiveness using real data. From the clinical trial data they released, we know that there were 36,523 people who had no evidence of prior COVID-19 exposure in the trial. They were split into two groups: a group who got the vaccine, and a group who got the placebo (a fake, harmless injection). Among the placebo group, 162 people got COVID-19, and among the vaccine group, only 8 people got COVID-19 6 . We don’t know how many people were in each of the two groups, but generally, researchers try to split people into two equally-sized groups. So let’s just make the assumption that there were 36,523/2=18,261.5 people in the vaccine group and 18,261.5 people in the placebo group. We know this assumption isn’t entirely true (because there can’t be 0.5 of a person) but we know that it’s really close, so our calculated effectiveness will be really close. So, the effectiveness is:

Lo and behold, Pfizer reports the effectiveness of their vaccine to be 95.0%, so we got it right (aside from that assumption we had to make)! 6
Next, let’s talk about confidence intervals. An effectiveness percentage is what’s known as a statistic, and statistics are estimated from data - in this case, clinical trial data. If we were to enroll every single person in the US in the clinical trial, we would get a perfect estimate of the vaccine’s effectiveness in the US population. But clinical trials are limited to a few tens of thousands of participants, at most. Researchers try their best to match the demographic makeup of the population when enrolling people in the trial, but the limited sample size necessarily means we won’t know the exact, true effectiveness. In other words, there will be a range of effectiveness values that are consistent with our data. This range is reported as a confidence interval around the effectiveness value, and usually looks like this: “94% effective [95% CI: 89-97%].” Here, we say the effectiveness point estimate is 94%, though the estimate probably falls within the range of 89% to 97%. But what does “probably” actually mean? To answer this question, we have to perform a thought experiment. Let’s say there are 100 parallel universes, and in every single one of them, researchers recruited the same number of people for the vaccine trial, performed the trial, and estimated the effectiveness. So now we have 100 values of effectiveness. The average of these values is 94%, but there is a range, with some parallel universes coming up with values less than 94% and some greater than 94%. The 95% confidence interval (95% CI) means that 95% of these values (=95 parallel universes) were between 89 and 97%. In scientific papers or news articles, you might also see 90% or 99% confidence intervals. This means that the researchers calculated the range of values in which 90 (or 99) of the parallel universes fell. 99% confidence intervals will be larger ranges than 95% confidence intervals, and 90% will be smaller than 95%, but the principle is the same 7 .
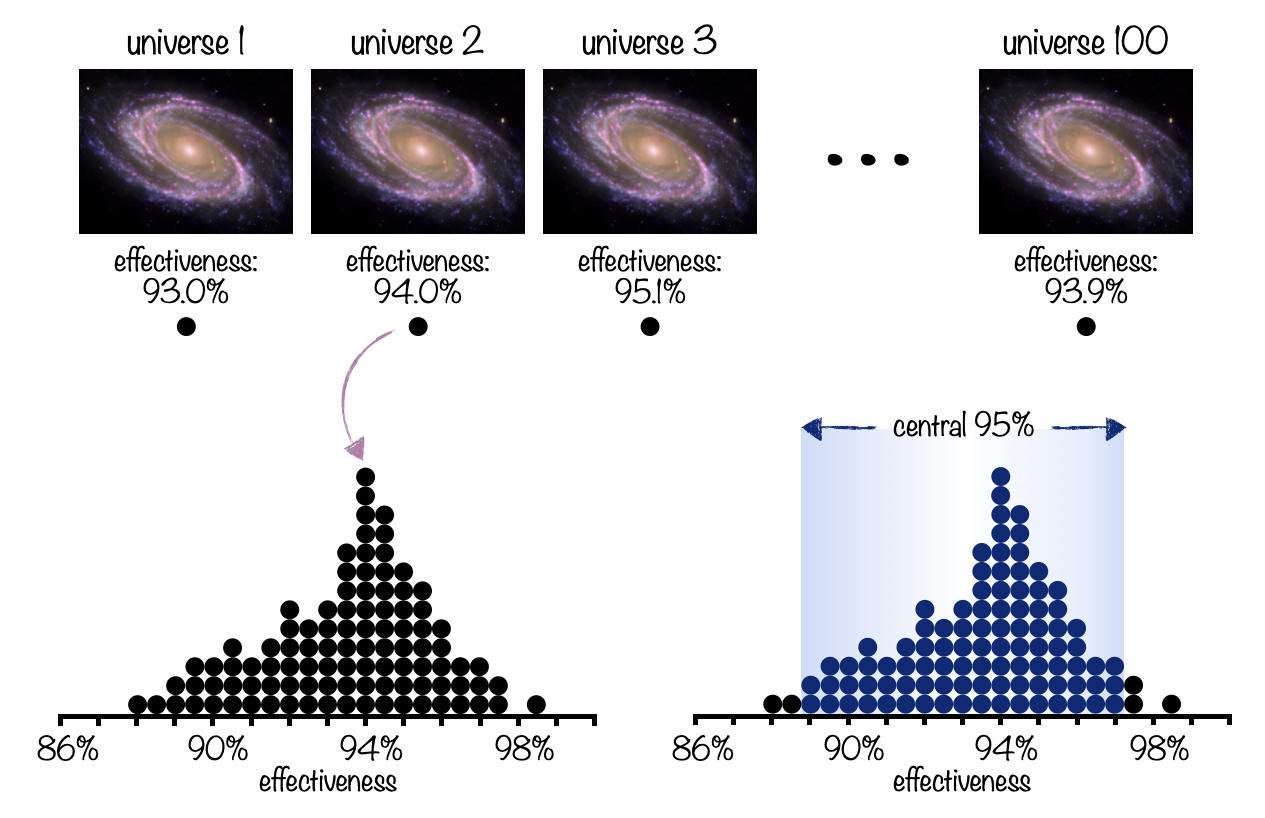
Figure 2: An illustration of the “parallel universe” concept to explain the interpretation of confidence intervals. Researchers in each of 100 parallel universes perform the clinical trial, and each gets an effectiveness value. The 95% confidence interval for the value is the range into which 95% of the values (=95 parallel universes) fell. Galaxy image courtesy of NASA (https://images.nasa.gov/details-PIA09579).
Obviously, in real life, we are not actually doing clinical trials 100 separate times or communicating with parallel universes (although that would be super cool). We calculate these confidence intervals using equations, which I’ll illustrate in a minute.
There are a lot of misconceptions about what a confidence interval means. Most people assume that a 95% confidence interval means that we are 95% sure that the true value (in this case, the true vaccine effectiveness) falls in the provided range (in this case, 89-97%). But this is not true. We can never know the true value of something, unless, for example, we programmed the true probability into a computer ourselves. Only the universe, or God, or Zeus (whatever you believe) knows the true probability of rain on Tuesday, or the true probability of the Kansas City Chiefs winning the Super Bowl, or the true effectiveness of a vaccine. The whole point of research is to get estimates of these quantities that are as accurate as possible. As such, our confidence intervals only tell us something about our estimated value, and can’t tell us anything about the true value. Luckily, if the experiment was designed well, the estimated value should be close to (and hopefully unbiased for) the true value 7 . Confidence intervals tell us something about how well our experiment was designed - small confidence intervals indicate a better estimated value, possibly because we had a lot of people in our clinical trial (large sample size) or because the drug’s effect was extremely noticeable (large effect size).
Let’s say we want to calculate the confidence interval for the Pfizer vaccine’s effectiveness. In addition to the number of people who got COVID-19 in both the vaccine and placebo groups (8 and 162, respectively), we also need to know the number of people in each group (which we assumed to be 18261.5 each) 6 , and the confidence level we want (a common choice is 95%). Normally, confidence intervals are straightforward to compute if we know these values 8 , but for the COVID-19 vaccine example specifically, they’re a bit harder. The difficulty comes from the fact that people’s cumulative exposure to COVID-19 increases over time (and thus is different depending on when each person entered the trial), and the fact that contracting COVID-19 is rare (only 170 people out of 36,523) 9 . These complications change the confidence interval formula slightly, to this 9 :

Here, we know:
- Effectiveness=95.06%, which we calculated before
- X=8, the number of people who got COVID-19 in the vaccine group
- Y=162, the number of people who got COVID-19 in the placebo group
- e≈2.718 is a mathematical constant
- The 1.96 is because we want a 95% confidence interval (specifically, it is the the 95% quantile cutoff of the normal distribution). So we have:

So we report that the Pfizer vaccine is 95.1% effective [95% CI: 90.0%-97.6%]. Indeed, Pfizer reports its own 95% confidence interval as [90.3%-97.6%] 6 . This slight discrepancy could again be due to our assumption of equal sample sizes, or Pfizer having different assumptions about people’s exposure over time.
Here are the effectiveness estimates and confidence intervals for each of the three currently-available vaccines. The first two columns are the estimates given by the companies themselves (who know all of the sample sizes), and the last two columns are calculated using the equation above:
| Reported Effectiveness | Reported 95% Confidence Interval | Calculated Effectiveness using Above Equations4 | Calculated Confidence Interval using Above Equations9 | |
|---|---|---|---|---|
| Pfizer | 95.0%6 | 90.3-97.6%6 | 95.1% | 90.0-97.6% |
| Moderna | 94.1%10 | 89.3-96.8%10 | 94.1% | 89.1%-96.8% |
| Johnson&Johnson | 66.9%11 | 59.0-73.4%11 | 66.6% | 61.2-71.2% |
You can see that our calculations agree well with what the companies report - yay!
It’s also important to note that while we calculate confidence intervals the same way each time, we can’t directly compare the effectiveness of these three vaccines. This is because each clinical trial started at a different time, used different populations around the world, different mixes of young and elderly people, and different definitions of “severe” vs “moderate” disease 12 . For example, the Johnson&Johnson clinical trial included people in the UK and South Africa, where more severe strains of COVID-19 are circulating 11 . This could have contributed to Johnson&Johnson’s lower effectiveness estimate - the Pfizer and Moderna trials didn’t include people exposed to the mutated strains, against which the vaccine might have been less effective. Thus, we can’t say for certain that Pfizer and Moderna are “better” than Johnson&Johnson - to answer that question, we’d have to run a clinical trial directly comparing the vaccines against each other in a shared group of participants.
SIDE EFFECTS
So that’s effectiveness. But regardless of how well a vaccine works, people don’t want to get it if it has unpleasant or even dangerous side effects. In this section, we’ll explore the common and uncommon side effects of the three COVID-19 vaccines.
There are four general types of side effects. The first is from the process of physically injecting something into your arm. This includes the pinch you feel when the needle goes in, as well as redness or swelling around the injection site. These are mild and expected.
The second type includes side effects from your immune system responding to the virus. These are extremely common, and highly desirable, since they indicate that the vaccine is working! If you read last week’s article, you know that vaccines work by mimicking your body’s natural immune response. The vaccine primes your immune system to recognize a certain virus, either by supplying parts of the dead virus or some of the virus’ genetic code (mRNA). Then, when you encounter the virus in the wild, your body will know how to fight it immediately, preventing you from getting sick. This process is quite taxing on your body, and can lead to fever, swelling, fatigue, headache, chills, muscle pain, and nausea. If this sounds similar to having the flu or a cold, that’s because it is. Since the same immune processes are occurring whether you are actually sick or just got a vaccine, the symptoms you experience are quite similar. However, vaccine side effects are milder and only last for about a day after you receive the injection, while cold or flu symptoms can be more severe and can last several days. These immune-related side effects are typically more severe after the second dose (if you are taking a two-dose vaccine), since your body recognizes the virus particles the second time and reacts very strongly. These side effects are also more severe in younger people, who generally have stronger immune systems than older people. Just how common are they? Depending on vaccine type, 80-90% of young people and 65-80% of older people experienced pain at the injection site. The next most common symptoms were fatigue and headache, affecting about 60-70% of young people and 50-60% of older people. Muscle pain was also very common, affecting 35-60% of young people and 30-45% of older people 13,14 . These side effects occur at lower rates for the Johnson & Johnson vaccine, since it is a single-dose vaccine 15 . But even if you’re a younger person signing up for a two-dose vaccine, don’t fret. Even though your likelihood of immune-related side effects is greater than other groups, if you can handle getting a cold, you can certainly handle these symptoms.
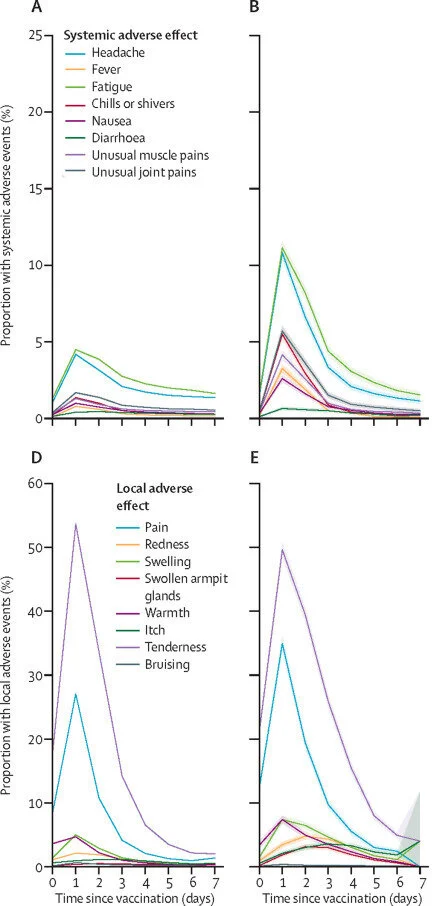
Figure 3: Side effects observed after the Pfizer vaccine. A and D are after the first dose, and B and E are after the second dose.
The third type of side effect includes rare allergic reactions to components of a vaccine. People can be allergic to components in any drug or vaccine, not just the COVID-19 vaccine. Aside from the active ingredients in a vaccine (dead virus particles or mRNA), there are other components, including molecules that stabilize the active ingredients, help them tolerate warmer temperatures, or help guide the active ingredients into your immune cells. People with known allergies to any of these ingredients should not get the vaccine 16 . But these allergies are extremely rare, and in addition, you probably wouldn’t know if you had one. Because you might not know, you are required to wait at the vaccine center for 15-30 minutes after receiving the injection, so the staff can monitor you for any signs of allergic reaction. Severe reactions, known as anaphylaxis, affect 2-5 people per 1,000,000 vaccinated (0.0002-0.0005%). Even if a severe allergic reaction does occur, the on-site medical personnel are well-equipped with the drugs necessary to stop it 17 .
The fourth type of side effect is anxiety-related. A lot of people have a fear of needles, which can manifest as physical symptoms including fainting, rapid breathing, numbness, low blood pressure, numbness, or tingling. These side effects are harmless, are generally expected by the person experiencing them, and typically resolve quickly (within the waiting period). Fainting occurs at a rate of less than 8 per 100,000 doses (0.008%), and is not usually dangerous because people are sitting when they receive the vaccine 18 .
All of the above side effects can occur with any of the three vaccines. In addition, the Johnson&Johnson vaccine carries an extremely miniscule (but highly sensationalized) risk of thrombosis with thrombocytopenia syndrome, or TTS. The CDC paused administration of the Johnson&Johnson vaccine on April 13th, 2021, following reports of blood clots in younger women. After fully investigating the cases, the CDC gave the go-ahead 10 days later, on April 23rd, 2021. We know now that the risk of this side effect is extremely low, with about 7 occurrences per 1,000,000 doses given to women between 18 and 49 (0.0007%). The risk is much much lower in men and older women, and the benefits far outweigh the risks for all groups. Regardless, for three weeks after you get the Johnson&Johnson vaccine, you should be on the lookout for symptoms of TTS - headaches, blurred vision, shortness of breath, chest pain, leg swelling, abdominal pain, and easy bruising. The condition can be severe, but is treatable 19 . And if you are a younger woman and still concerned, you can get the Pfizer or Moderna vaccine instead.
CONCLUSION
COVID-19 vaccines are safe and effective. In the United States, the Pfizer, Moderna, and Johnson&Johnson vaccines were all approved under an Emergency Use Authorization (EUA) from the FDA (read last week’s article to learn more about this process). Although the EUA means the vaccines were approved faster than usual, this does not mean that safety standards were at all relaxed. Historically, over all vaccines given for all diseases, side effects generally occur within 6 weeks. Taking a conservative approach, the FDA required at least 8 weeks of safety data for the COVID-19 vaccines before approving them for the general public in December 2020. In addition, FDA and CDC scientists are continuing to investigate side effects and safety concerns as more and more doses are given 20 . This is because we can only detect extremely rare side effects (like the TTS risk from the Johnson&Johnson vaccine) once a large enough number of doses are given. To illustrate this, consider a side effect with a risk of 0.0001% (1 in 1,000,000). It is likely to occur only once in a study of 1,000,000 people, so in a clinical trial of 40,000, it is not likely to be observed at all. This is how even unusually large clinical trials (all of these vaccines were first studied in 35-45,000 people) can miss extremely rare side effects. You should not take this as criticism of the research, but rather reassurance that severe side effects are very, very rare.
All of us want things to go back to normal - to see our loved ones again, to go to parties and concerts, to travel, and to leave the isolation of our homes. The most important thing you can do (if you’re medically able to) is get vaccinated - with any of the three vaccines that you can get your hands on. The CDC currently recommends COVID-19 vaccination for everyone ages 12 and over - here’s how you can sign up 21 . When enough people are vaccinated, we’ll have reached herd immunity, when COVID-19 can no longer spread in the population. Won’t it be nice to go back to normal life?
Next week, we’ll explore the historical and contemporary reasons for vaccine hesitancy, and how you can help encourage your loved ones to get vaccinated.
REFERENCES
- “WHO Coronavirus (COVID-19) Dashboard.” World Health Organization, World Health Organization, 2021, https://covid19.who.int/.
- “Coronavirus (COVID-19) Vaccinations - Statistics and Research.” Our World in Data, Our World in Data, 22 June 2021, https://ourworldindata.org/covid-vaccinations?country=USA.
- McNeil, Shelly. “Overview of Vaccine Efficacy and Vaccine Effectiveness.” Canadian Center for Vaccinology, World Health Organization, 2021, www.who.int/influenza_vaccines_plan/resources/Session4_VEfficacy_VEffectiveness.PDF.
- “Lesson 3: Measures of Risk.” Principles of Epidemiology in Public Health Practice, Third Edition An Introduction to Applied Epidemiology and Biostatistics, CDC, 18 May 2012, www.cdc.gov/csels/dsepd/ss1978/lesson3/section6.html.
- Olliaro, Piero. “What Does 95% COVID-19 Vaccine Efficacy Really Mean?” The Lancet Infectious Diseases, vol. 21, no. 6, 2021, p. 769. Crossref, doi:10.1016/s1473-3099(21)00075-x.
- Rose, Amy, et al. “Pfizer and BioNTech Announce Publication of Results from Landmark Phase 3 Trial of BNT162b2 COVID-19 Vaccine Candidate in The New England Journal of Medicine | Pfpfizeruscom.” Pfizer, Pfizer, 10 Dec. 2020, www.pfizer.com/news/press-release/press-release-detail/pfizer-and-biontech-announce-publication-results-landmark.
- Tan, Sze Huey, and Say Beng Tan. “The Correct Interpretation of Confidence Intervals.” Proceedings of Singapore Healthcare, vol. 19, no. 3, 2010, pp. 276–78. Crossref, doi:10.1177/201010581001900316.
- Wikipedia contributors. “Confidence Interval.” Wikipedia, 10 June 2021, en.wikipedia.org/wiki/Confidence_interval#Basic_steps.
- Fu, Wenjiang, et al. “Covid-19 Vaccine Efficacy: Accuracy, Uncertainty and Projection of Cases.” MedRxiv, 2020. Crossref, doi:10.1101/2020.12.16.20248359.
- “GRADE: Moderna COVID-19 Vaccine | CDC.” Advisory Committee on Immunization Practices (ACIP), CDC, 20 Dec. 2020, www.cdc.gov/vaccines/acip/recs/grade/covid-19-moderna-vaccine.html.
- Sadoff, Jerald, et al. “Safety and Efficacy of Single-Dose Ad26.COV2.S Vaccine against Covid-19.” New England Journal of Medicine, vol. 384, no. 23, 2021, pp. 2187–201. Crossref, doi:10.1056/nejmoa2101544.
- Ledford, Heidi. “Why COVID Vaccines Are so Difficult to Compare.” Nature, Nature, 23 Feb. 2021, www.nature.com/articles/d41586-021-00409-0?error=cookies_not_supported&code=8744ad78-586a-4d5d-b14f-3eb5f40209b9.
- “Reactions and Adverse Events of the Pfizer-BioNTech COVID-19 Vaccine | CDC.” Vaccines & Immunizations, CDC, 14 May 2021, www.cdc.gov/vaccines/covid-19/info-by-product/pfizer/reactogenicity.html.
- “Local Reactions, Systemic Reactions, Adverse Events, and Serious Adverse Events: Moderna COVID-19 Vaccine | CDC.” Vaccines & Immunizations, CDC, 20 Dec. 2020, www.cdc.gov/vaccines/covid-19/info-by-product/moderna/reactogenicity.html.
- “Local Reactions, Systemic Reactions, Adverse Events, and Serious Adverse Events: Janssen COVID-19 Vaccine (J&J) | CDC.” Vaccines & Immunizations, CDC, 26 Feb. 2021, www.cdc.gov/vaccines/covid-19/info-by-product/janssen/reactogenicity.html.
- “Information about the Moderna COVID-19 Vaccine.” COVID-19, CDC, 11 June 2021, www.cdc.gov/coronavirus/2019-ncov/vaccines/different-vaccines/Moderna.html.
- “Selected Adverse Events Reported after COVID-19 Vaccination.” COVID-19, CDC, 11 Feb. 2020, www.cdc.gov/coronavirus/2019-ncov/vaccines/safety/adverse-events.html.
- “Johnson & Johnson’s Janssen COVID-19 Vaccine Overview and Safety.” COVID-19, CDC, 1 June 2021, www.cdc.gov/coronavirus/2019-ncov/vaccines/different-vaccines/janssen.html.
- Office of the Commissioner. “FDA and CDC Lift Recommended Pause on Johnson & Johnson (Janssen) COVID-19 Vaccine Use Following Thorough Safety Review.” U.S. Food and Drug Administration, FDA, 24 Apr. 2021, www.fda.gov/news-events/press-announcements/fda-and-cdc-lift-recommended-pause-johnson-johnson-janssen-covid-19-vaccine-use-following-thorough.
- “Safety of COVID-19 Vaccines.” COVID-19, CDC, 21 June 2021, www.cdc.gov/coronavirus/2019-ncov/vaccines/safety/safety-of-vaccines.html.
- Simmons-Duffin, Selena. “Ready To Get The COVID Vaccine? Here’s How To Book It In Your State.” NPR Shots, NPR, 3 May 2021, www.npr.org/sections/health-shots/2021/02/18/967448680/how-to-sign-up-for-a-covid-19-vaccine-in-your-state.